
Marketing Analytics
Measuring Success with Data
Introduction
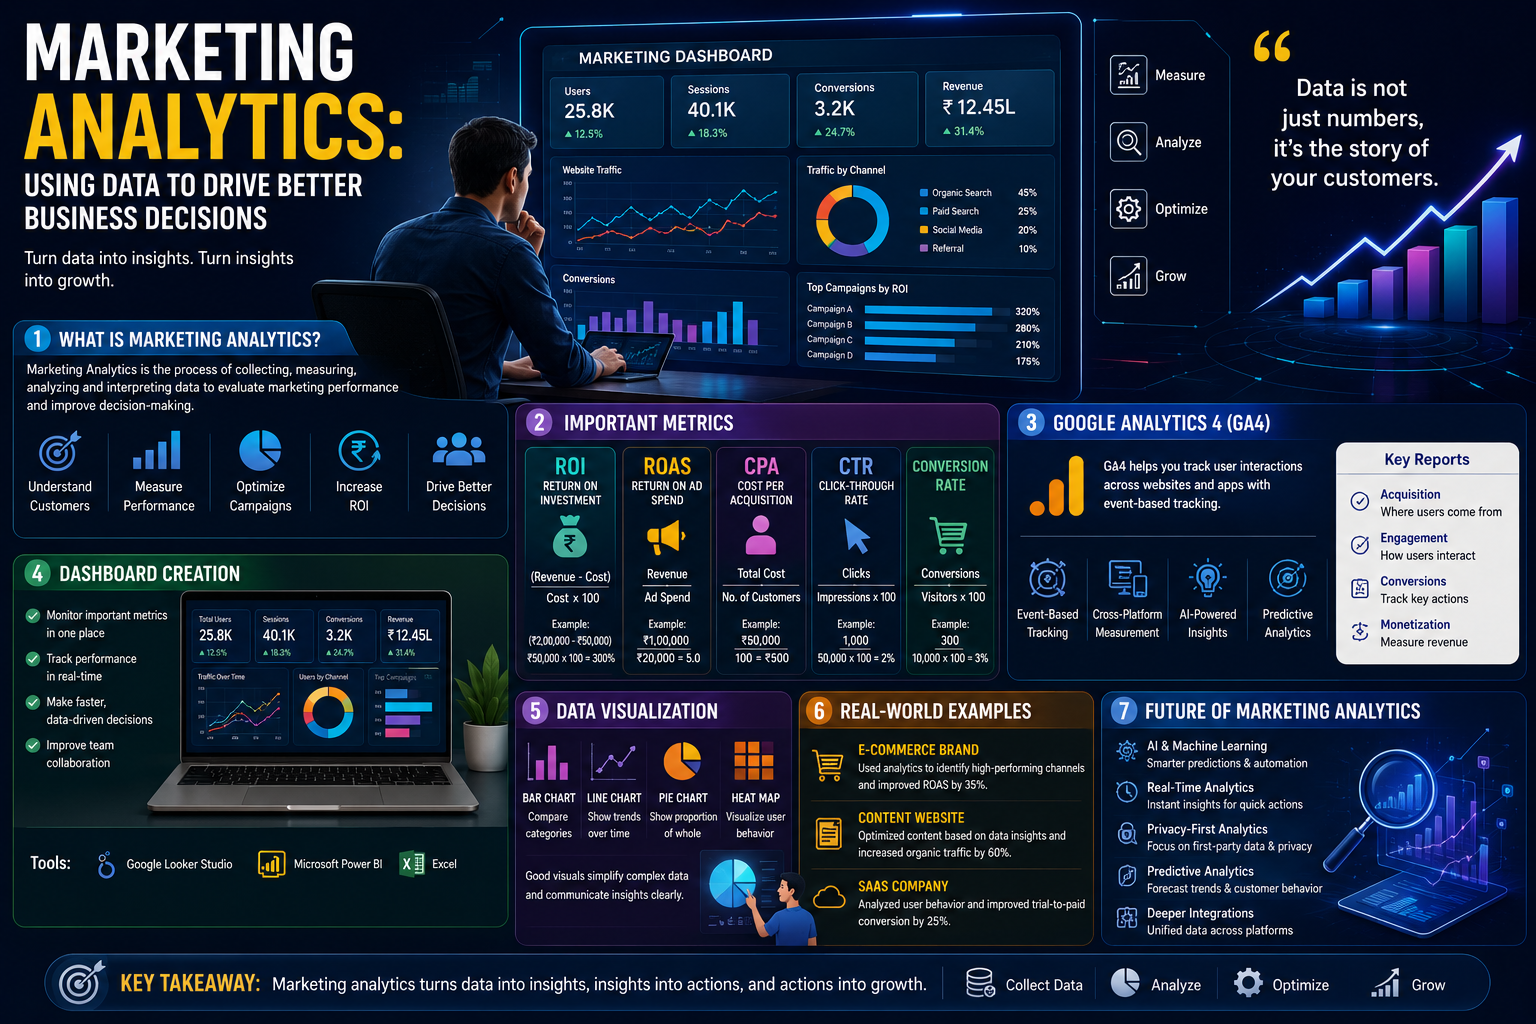
In today’s digital economy, successful marketing is no longer based on assumptions or intuition alone. Businesses now rely on data to understand customer behavior, measure campaign performance, optimize budgets, and make smarter decisions. This data-driven approach is known as Marketing Analytics.
Marketing analytics helps organizations track key performance indicators (KPIs), evaluate return on investment, and uncover insights that lead to better business outcomes. From Google Analytics 4 to interactive dashboards and AI-powered forecasting, analytics has become the backbone of modern marketing strategies.
This guide explores the fundamentals of marketing analytics, important metrics, dashboard creation, data visualization techniques, real-world examples, and future trends shaping the industry.
What is Marketing Analytics?
Marketing Analytics is the process of collecting, measuring, analyzing, and interpreting marketing data to improve decision-making and optimize business performance.
It helps marketers answer critical questions such as:
- Which campaigns generate the highest ROI?
- What channels bring the most valuable customers?
- How much does it cost to acquire a customer?
- Which content performs best?
- What improvements can increase conversions?
The primary objectives of marketing analytics include:
- Measuring campaign effectiveness
- Understanding customer behavior
- Optimizing marketing budgets
- Improving conversion rates
- Increasing profitability
- Supporting data-driven decisions
Without analytics, businesses risk making decisions based on guesswork rather than evidence.
Important Marketing Metrics
Marketing professionals use Key Performance Indicators (KPIs) to evaluate campaign performance and business success.
Return on Investment (ROI)
ROI measures the profitability of marketing activities.
Formula:
ROI = ((Revenue – Marketing Cost) ÷ Marketing Cost) × 100
Example:
Marketing Investment = ₹50,000
Revenue Generated = ₹2,00,000
ROI = ((2,00,000 – 50,000) ÷ 50,000) × 100
ROI = 300%
This means every ₹1 invested generated ₹3 in profit.
High ROI indicates efficient marketing strategies.
Return on Ad Spend (ROAS)
ROAS specifically measures the revenue generated from advertising campaigns.
Formula:
ROAS = Revenue from Ads ÷ Ad Spend
Example:
Ad Spend = ₹20,000
Revenue = ₹1,00,000
ROAS = 5
This means every ₹1 spent on advertising generated ₹5 in revenue.
A higher ROAS generally indicates better campaign performance.
Cost Per Acquisition (CPA)
CPA measures how much it costs to acquire one customer.
Formula:
CPA = Total Marketing Cost ÷ Number of Customers Acquired
Example:
Marketing Cost = ₹50,000
Customers Acquired = 100
CPA = ₹500
Lower acquisition costs usually improve overall profitability.
Click-Through Rate (CTR)
CTR measures how many users click on an advertisement after seeing it.
Formula:
CTR = (Clicks ÷ Impressions) × 100
Example:
Clicks = 1,000
Impressions = 50,000
CTR = 2%
Higher CTR often indicates effective ad creatives and audience targeting.
Conversion Rate
Conversion Rate measures the percentage of users who complete desired actions.
These actions may include:
- Purchases
- Form submissions
- Newsletter sign-ups
- Downloads
Formula:
Conversion Rate = (Conversions ÷ Visitors) × 100
Example:
Visitors = 10,000
Conversions = 300
Conversion Rate = 3%
Optimizing conversion rates is one of the most important goals in digital marketing.
Understanding Google Analytics 4 (GA4)
Google Analytics 4 (GA4) is the latest version of Google’s analytics platform designed to provide deeper customer insights across websites and mobile applications.
Unlike Universal Analytics, GA4 uses an event-based data model.
Key Features of GA4
Event-Based Tracking
GA4 tracks user interactions as events, including:
- Page views
- Clicks
- Scrolls
- Downloads
- Video plays
- Purchases
This provides more flexible and detailed reporting.
Cross-Platform Measurement
Businesses can track customer journeys across:
- Websites
- Mobile applications
- Multiple devices
This creates a unified understanding of customer behavior.
AI-Powered Insights
GA4 uses machine learning to provide:
- Predictive audiences
- Purchase probability
- Revenue forecasting
- Automated insights
AI capabilities help marketers make proactive decisions.
Important GA4 Reports
Acquisition Reports
These reports show where users come from:
- Organic Search
- Paid Search
- Social Media
- Direct Traffic
- Referral Websites
Understanding acquisition channels helps optimize marketing investments.
Engagement Reports
Engagement metrics include:
- Average engagement time
- Events per user
- Session duration
- User activity
These insights help evaluate content performance.
Conversion Reports
Businesses can track:
- Sales
- Lead generation
- Sign-ups
- Downloads
Conversion tracking enables accurate performance measurement.
Dashboard Creation
Marketing dashboards transform raw data into actionable insights.
A dashboard provides a visual summary of important business metrics in one place.
Benefits of Dashboards
Marketing dashboards help businesses:
- Monitor campaign performance
- Identify trends quickly
- Make faster decisions
- Improve collaboration
- Save reporting time
Dashboards simplify complex datasets into understandable visuals.
Essential Dashboard Metrics
A comprehensive marketing dashboard should include:
Traffic Metrics
- Website Visitors
- Sessions
- Traffic Sources
- Bounce Rate
Conversion Metrics
- Leads Generated
- Conversion Rate
- Customer Acquisition Cost
- Revenue
Advertising Metrics
- ROAS
- CTR
- CPC
- CPA
Social Media Metrics
- Followers
- Engagement Rate
- Reach
- Impressions
Dashboard Tools
Popular dashboard tools include:
Google Looker Studio
Features:
- Free to use
- Google integration
- Interactive visualizations
- Real-time reporting
Microsoft Power BI
Capabilities include:
- Advanced analytics
- Data modeling
- Business intelligence dashboards
- Interactive reports
Excel Dashboards
Excel remains popular because of:
- Pivot tables
- Charts
- Formulas
- Flexibility
Many small businesses rely on Excel for marketing reporting.
Data Visualization
Data visualization helps marketers communicate insights more effectively.
Humans process visual information faster than raw numbers.
Bar Charts
Bar charts are useful for:
- Channel comparisons
- Campaign performance
- Sales analysis
Example:
Revenue by Marketing Channel:
- SEO: ₹8,00,000
- PPC: ₹6,00,000
- Social Media: ₹4,00,000
- Email Marketing: ₹2,00,000
Line Charts
Line charts show trends over time.
Examples include:
- Monthly website traffic
- Revenue growth
- Conversion trends
Trend analysis supports strategic decision-making.
Pie Charts
Pie charts represent proportions.
Examples:
Marketing Budget Allocation:
- SEO: 40%
- PPC: 30%
- Social Media: 20%
- Email Marketing: 10%
Heat Maps
Heat maps show how users interact with websites.
Businesses use tools like:
- Hotjar
- Microsoft Clarity
Heat maps help identify:
- Popular sections
- User behavior patterns
- Conversion bottlenecks
Real-World Examples
Understanding practical applications makes marketing analytics more meaningful.
Example 1: E-Commerce Company
An online fashion retailer analyzes:
- Traffic sources
- Customer acquisition costs
- Product performance
- Conversion rates
The company discovers that Instagram campaigns generate higher engagement but lower conversions compared to Google Search Ads.
As a result, they reallocate budgets to maximize profitability.
Example 2: Content Marketing Website
A digital marketing blog tracks:
- Organic traffic
- Keyword rankings
- Average engagement time
- Newsletter subscriptions
Analytics reveal that long-form educational content generates the highest engagement and conversions.
The business then focuses more resources on in-depth guides and tutorials.
Example 3: SaaS Business
A software company uses analytics to monitor:
- Trial sign-ups
- Customer retention
- Feature usage
- Customer lifetime value
The insights help improve onboarding experiences and increase subscription renewals.
The Future of Marketing Analytics
Technology is transforming the future of marketing measurement and decision-making.
Artificial Intelligence (AI)
AI-powered analytics tools now provide:
- Predictive insights
- Automated reporting
- Customer segmentation
- Personalized recommendations
AI reduces manual analysis and improves decision quality.
Privacy-First Analytics
Data privacy regulations continue to evolve.
Businesses increasingly focus on:
- First-party data
- Consent management
- Ethical data practices
- Cookieless tracking solutions
Privacy will become a critical component of future analytics strategies.
Real-Time Analytics
Organizations now expect instant access to performance data.
Real-time dashboards enable:
- Faster optimization
- Immediate problem-solving
- Better campaign management
Speed will become a major competitive advantage.
Predictive Analytics
Predictive models help businesses forecast:
- Customer behavior
- Revenue trends
- Churn rates
- Purchase probabilities
Future marketing strategies will rely heavily on predictive intelligence.
Marketing Automation Integration
Analytics platforms increasingly integrate with:
- CRM systems
- Email marketing tools
- Advertising platforms
- Customer support systems
Unified ecosystems create more accurate customer insights.